How to Use Feature Layer TrafficIncidents
The Feature Layer PTV_TrafficIncidents enables you to use dynamic traffic information.
This layer provides actual traffic information to consider incidents like traffic jams in the route planning.
Up-to-date traffic information is provided as dynamic FeatureLayer and can be downloaded from the Layer Delivery Server with the PTV Content Update Service plugin.
To activate this service please contact your PTV sales representative.
Related Topics
The following topics might be relevant for this use case.
Terminology
Check these terms to ensure you understand the whole use case.
- Feature Layer
-
The Feature Layer (FL) defines the additional data mechanism. The data is partitioned into several themes that characterise different use-cases.
- PTV Content Updates Service
-
The PTV Content Update Service (CUS) enables additional data content to be automatically downloaded and provided. A separate PTV Layer Delivery Server (LDS) provides current data such as toll updates and Traffic Incidents Feature Layer, which is automatically downloaded via the CUS and can be used from a PTV xServer.
Benefits
PTV xRoute Server
Using FL TrafficIncidents you can get a routing result respecting actual traffic information.
PTV xMap Server
Additionally the user can easily visualise PTV_TrafficIncidents data on the map using PTV xMap server. This visualisation on the map has the following benefits for the customer:
- Improve the acceptance of a route which was calculated taking PTV_TrafficIncidents into account.
Prerequisites
Check if the following prerequisites are fulfilled before you start with the use case.
-
Both servers needs a PTV map which supports Traffic Incidents. See About Feature Layer for more information.
-
Installation of Feature Layer "PTV_TrafficIncidents". The usage of this Feature Layer in conjunction with PTV xRoute and PTV xMap server is available in version 1.20.0 or higher.
-
In order to request information from the feature layer theme PTV_TrafficIncidents, you need to ensure that the following license key includes the theme PTV_TrafficIncidents
- For PTV xRoute Server: xroute.featureLayerThemes=PTV_TrafficIncidents, ...
- For PTV xMap Server: xmap.featureLayerThemes=PTV_TrafficIncidents, ...
Concept
Feature layers are designed to provide various additional data to the user. The content depends on the feature layer theme and can be configured via XML profile. In the PTV xRoute server, feature layer data can be requested as generic FeatureDescription element for each route segment.
The FL Traffic Incidents is a dynamic Feature Layer which has to be installed via PTV Content Updates Service. Therefore, the PTV xServer has to be able to access the internet.
Installation Guide
-
Download the current version of the PTV Content Update Service in the Customer Area. A customer login is required: Customer Area
-
Configure the PTV Content Update Service according to the steps listed in PTV Content Update Service
-
Restart the PTV xServer to activate the enabled PTV Content Update Service.
-
Use PTV xRoute or PTV xMap and activate Feature Layer via Profile or Profile XML Snippet.
Programming Guide
Feature Matrix for Feature Layer Traffic Incidents
Find out which service method of PTV xRoute Server supports the PTV_TrafficIncidents feature layer theme.
| calculateRouteInfo |
x |
| calculateRoute |
x |
| calculateExtendedRoute |
x |
| calculateTour |
- |
| calculateAdvancedTour |
- |
| calculateMatrixInfo |
x |
| calculateReachableObjects |
- |
| searchForReachableObjects |
- |
| calculateIsochrones |
- |
Use a routing request with at least two stations where a traffic jam is in between and enable the use of the feature layer theme PTV_TrafficIncidents by setting the following XML profile snippet in the CallerContext.
<?xml version="1.0" encoding="UTF-8" standalone="yes"?>
<Profile>
	<Common language="en" majorVersion="1" minorVersion="0"/>
	<Routing majorVersion="2" minorVersion="0">
		<Course>
			<AdditionalDataRules enabled="true"/>
		</Course>
	</Routing>
	<FeatureLayer majorVersion="1" minorVersion="0">
		<GlobalSettings enableTimeDependency="true"/>
		<Themes>
			<Theme id="PTV_TrafficIncidents" enabled="true">
				<FeatureDescription includeTimeDomain="true" includeLanguageCode="true">
					<Property id="*" included="true"/>
					<Property id="message" included="true"/>
				</FeatureDescription>
			</Theme>
		</Themes>
	</FeatureLayer>
</Profile>
This sample is working with a static Feature Layer Traffic Incidents which is in the standard data of all PTV xServer. It contains Traffic Incidents for Luxembourg on 2014-11-05. This is the reason why this sample is working without configuring the PTV Content update Service.
 JSON sample Request: Routing with Traffic Incidents with the method calculateRoute()
{
  "waypoints": [
    {
      "$type": "WaypointDesc",
      "linkType": "NEXT_SEGMENT",
      "fuzzyRadius": 0,
      "coords": [
        {
          "$type": "Point",
          "point": {
            "$type": "PlainPoint",
            "x": 665818,
            "y": 6358638
          }
        }
      ]
    },
    {
      "$type": "WaypointDesc",
      "linkType": "NEXT_SEGMENT",
      "fuzzyRadius": 0,
      "coords": [
        {
          "$type": "Point",
          "point": {
            "$type": "PlainPoint",
            "x": 665817,
            "y": 6354642
          }
        }
      ]
    }
  ],
  "options": [
    {
      "parameter": "START_TIME",
      "value": "2014-11-05T13:00:00+00:00"
    }
  ],
  "exceptionPaths": null,
  "details": {
    "manoeuvres": true,
    "polygon": true,
    "detailLevel": "STANDARD",
    "dynamicInfo": false,
    "segments": true,
    "featureDescriptions": true
  },
  "callerContext": {
    "properties": [
      {
        "key": "ResponseGeometry",
        "value": "WKB"
      },
      {
        "key": "CoordFormat",
        "value": "PTV_MERCATOR"
      },
      {
        "key": "Profile",
        "value": "carfast"
      },
      {
        "key": "ProfileXMLSnippet",
        "value": "<?xml version=\"1.0\" encoding=\"UTF-8\" standalone=\"yes\"?><Profile xmlns:ns2=\"http://www.ptv.de/com/ptvag/xserver/engines/xpoidbaccess\"> <Routing majorVersion=\"2\" minorVersion=\"0\">  <Course>   <AdditionalDataRules enabled=\"true\"/>  </Course> </Routing> <FeatureLayer majorVersion=\"1\" minorVersion=\"0\">  <GlobalSettings enableTimeDependency=\"true\"/>  <Themes><Theme id=\"PTV_TrafficIncidents\" enabled=\"true\"/>  </Themes> </FeatureLayer></Profile>"
      }
    ]
  }
}
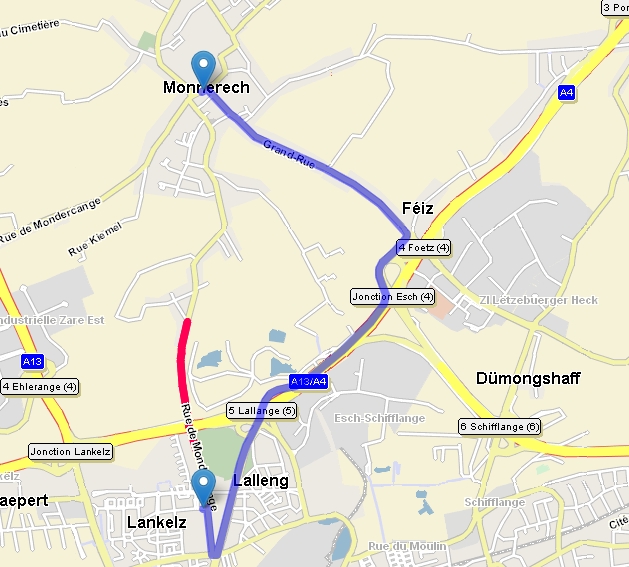
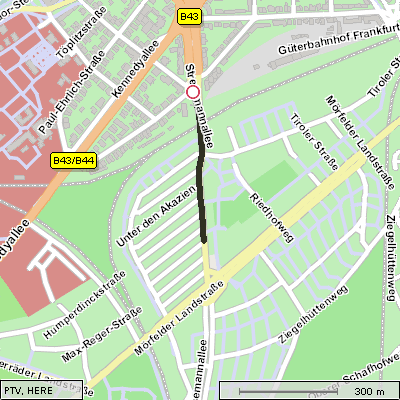
With the enabled feature layer PTV_TrafficIncidents we get a routing which avoids a traffic jam:
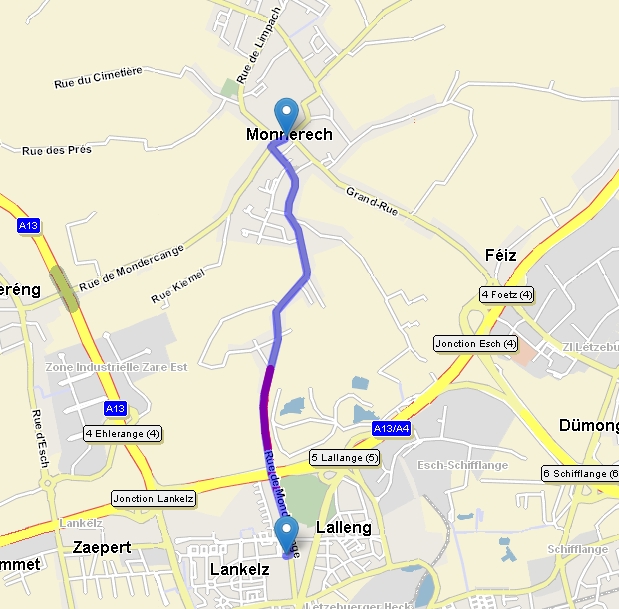
JSON sample Request: Visualise calculateRoute() with enabled option dynamicTimeOnStaticRoute to drive the static route
{
  "waypoints": [
    {
      "$type": "WaypointDesc",
      "linkType": "NEXT_SEGMENT",
      "fuzzyRadius": 0,
      "coords": [
        {
          "$type": "Point",
          "point": {
            "$type": "PlainPoint",
            "x": 665818,
            "y": 6358638
          }
        }
      ]
    },
    {
      "$type": "WaypointDesc",
      "linkType": "NEXT_SEGMENT",
      "fuzzyRadius": 0,
      "coords": [
        {
          "$type": "Point",
          "point": {
            "$type": "PlainPoint",
            "x": 665817,
            "y": 6354642
          }
        }
      ]
    }
  ],
  "options": [
    {
      "parameter": "START_TIME",
      "value": "2014-11-05T13:00:00+00:00"
    }
  ],
  "exceptionPaths": null,
  "details": {
    "manoeuvres": true,
    "polygon": true,
    "detailLevel": "STANDARD",
    "dynamicInfo": false,
    "segments": true,
    "featureDescriptions": true
  },
  "callerContext": {
    "properties": [
      {
        "key": "ResponseGeometry",
        "value": "WKB"
      },
      {
        "key": "CoordFormat",
        "value": "PTV_MERCATOR"
      },
      {
        "key": "Profile",
        "value": "carfast"
      },
      {
        "key": "ProfileXMLSnippet",
        "value": "<?xml version=\"1.0\" encoding=\"UTF-8\" standalone=\"yes\"?><Profile xmlns:ns2=\"http://www.ptv.de/com/ptvag/xserver/engines/xpoidbaccess\">  <Routing majorVersion=\"2\" minorVersion=\"0\">  <Course>   <AdditionalDataRules enabled=\"true\"/>   <DynamicRouting dynamicTimeOnStaticRoute=\"true\"/>  </Course> </Routing>  <FeatureLayer majorVersion=\"1\" minorVersion=\"0\">      <GlobalSettings enableTimeDependency=\"true\"/>  <Themes>               <Theme id=\"PTV_TrafficIncidents\" enabled=\"true\"/>  </Themes> </FeatureLayer></Profile>"
      }
    ]
  }
}
The response contains a FeatureDescription which was requested with the option featureDescriptions of the element
ResultListOptions like this one:
The FeatureDescription contains special properties for each FeatureLayer. They are documented within the section Technical Concepts: About Feature Layer.
Visualisation of PTV_TrafficIncidents on the map
This section describes the general flow how to visualise PTV_TrafficIncidents on the map.
Subsequent visualisation examples are just using different Profile XML Snippets - each of them described below - but following the same general Flow
Flow:
- Ensure that the PTV_TrafficIncidents theme is correctly installed and licensed for your PTV xMap Server.
- In order to activate the usage of PTV_TrafficIncidents the sample JSON request below must set at least the following parameters.
- Reference coordinates of the bounding box
- Starting reference time (note that PTV_TrafficIncidents is a time dependent theme)
- The imageinfo element defining the size and format of the returned image
- A valid ProfileXMLSnippet shown hereunder enabling the FeatureLayer to be visualised
- Send the JSON sample request to PTV xMap Server and look at the resulting image.
ProfileXMLSnippet: Enabling Feature Layer PTV_TrafficIncidents
<Profile xmlns:xsi='http://www.w3.org/2001/XMLSchema-instance'>
 <FeatureLayer majorVersion='1' minorVersion='0'>
  <!--enable the time dependency because we are using the time dependent PTV_TrafficIncidents theme-->
  <GlobalSettings enableTimeDependency='true'/>
  <Themes>
  <!--enable the PTV_TrafficIncidents theme-->
   <Theme id='PTV_TrafficIncidents' enabled='true'/>
   </Themes>
 </FeatureLayer>
</Profile>
Default rendering settings for PTV_TrafficIncidents
The following section shows the default settings of the PTV_TrafficIncidents feature layer in the silkysand rendering style, which is used for the following examples. These settings are displayed and summarised with the associated XML snippets. Please refer to About Feature Layer Rendering for an overview of all rendering possibilities.
<Class name="AbsoluteSpeed-Slow">
 <Filter>
  <Condition displayClass="AbsoluteSpeed">
   <Range values="1-35"/>
  </Condition>
 </Filter>
 <Style>
  <Geometry displayRange="9-14">
   <Stroke color="#FF0000" transparency="20" perpendicularOffset="50%" width="50%">
    <Arrows drawStroke="false" drawFill="false" fillColor="#FFFFFF" strokeColor="#000000"/>
   </Stroke>
   <RenderLevel renderOffset="+10"/>
  </Geometry>
  <Geometry displayRange="15-23">
   <Stroke color="#FF0000" transparency="20" perpendicularOffset="50%" width="50%">
    <Arrows drawStroke="false" drawFill="true" fillColor="#FFFFFF" strokeColor="#000000"/>
   </Stroke>
   <RenderLevel renderOffset="+10"/>
  </Geometry>
 </Style>
</Class>
Traffic Incidents, which will considerably reduce the speed, are summarised under AbsoluteSpeed-Slow. On a small scale (DisplayRange=“9-14“), these are shown as red (color=“FF0000“) and displaced (perpendicularOffset=“50%“) lines. On a large scale (DisplayRange=“15-23“), this line is extended with a white arrow in the direction of travel (drawFill=“true“, fillColor=“#FFFFFF“).
<Class name="AbsoluteSpeed-MediumToFast">
 <Filter>
  <Condition displayClass="AbsoluteSpeed>
   <Range values="36-200"/>
  </Condition>
 </Filter>
 <Style>
  <Geometry displayRange="9-14">
   <Stroke color="#FF661a" transparency="50" perpendicularOffset="50%" width="50%">
    <Arrows drawStroke="false" drawFill="false" fillColor="#FFFFFF" strokeColor="#000000"/>
   </Stroke>
   <RenderLevel renderOffset="+10"/>
  </Geometry>
  <Geometry displayRange="15-23">
   <Stroke color="#FF661a" transparency="40" perpendicularOffset="50%" width="50%">
    <Arrows drawStroke="false" drawFill="true" fillColor="#FFFFFF" strokeColor="#000000"/>
   </Stroke>
   <RenderLevel renderOffset="+10"/>
  </Geometry>
 </Style>
</Class>
Traffic Incidents with less effects on the speed are summarised in AbsoluteSpeed-MediumToFast. These are distinguished slightly in the representation through orange colouring (color=“#FF661A“).
Because traffic information are categorised it's necessary to define the category number within the regarding class. Here you can find a complete list of the categories and the regarding icons:
Classes of Traffic Incidents and Truck Attributes.
The representation of icons can be configured with the Style tag of a class. A DisplayRange is specified for each icon, i.e. a range of the zoom level at which the icon should be displayed. By default, three icons are specified in different sizes depending on the DisplayRange. The placing of an icon always relates to a reference point given by the provider at the start of the traffic information (e.g. start of congestion). Please go to About Feature Layer Rendering for further information.
<Class name="BlockedRoad">
 <Filter>
  <Condition displayClass="IncidentCategory">
   <Range values="51"/>
  </Condition>
 </Filter>
 <Style>
  <Geometry displayRange="9-23">
   <Stroke color="#606060" transparency="20" perpendicularOffset="0" width="90%"/>
   <RenderLevel renderOffset="+10"/>
  </Geometry>
  <Icon displayRange="9-16" url="./22x22/traffic/blocked_road.bmp"/>
  <Icon displayRange="17-19" url="./24x24/traffic/blocked_road.bmp"/>
  <Icon displayRange="20-23" url="./32x32/traffic/blocked_road.bmp"/>
 </Style>
</Class>
All segments of the BlockedRoad class within the DisplayRange 9-23 are shown as a grey line (color="606060").
Be aware that a changed zoom level at DisplayRange can cause loss of performance!
Below you can find a JSON sample request which can be directly copied and put into the raw request runner of a PTV xMap Server to be tested.
JSON sample Request: Visualise TrafficIncidents on the map
{
  "mapSection": {
    "$type": "MapSection",
    "center": {
      "$type": "Point",
      "point": {
        "$type": "PlainPoint",
        "x": 681142,
        "y": 6369874
      }
    },
    "scale": 1000,
    "scrollHorizontal": 0,
    "scrollVertical": 0,
    "zoom": 0
  },
  "mapParams": {

    "showScale": true,
    "useMiles": false
  },
  "imageInfo": {
    "format": "GIF",
    "width": 400,
    "height": 400,
    "imageParameter": ""
  },
  "layers": null,
  "includeImageInResponse": true,
  "callerContext": {
    "log1": "$TEST",
    "properties": [
      {
        "key": "CoordFormat",
        "value": "PTV_MERCATOR"
      },
      {
        "key": "ProfileXMLSnippet",
        "value":  "<Profile xmlns:xsi=\"http://www.w3.org/2001/XMLSchema-instance\" xsi:noNamespaceSchemaLocation=\"http:///xmap/schema/XMapProfile.xsd\"> <FeatureLayer majorVersion=\"1\" minorVersion=\"0\"> <GlobalSettings enableTimeDependency=\"true\"/> <Themes> <Theme enabled=\"true\" id=\"PTV_TrafficIncidents\"/> </Themes> </FeatureLayer> </Profile>"
      },
      {
        "key": "Profile",
        "value": "silkysand"
      }
    ]
  }
}
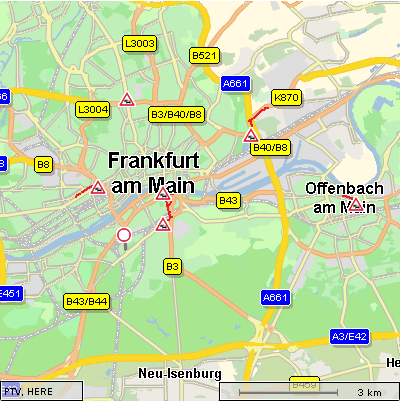
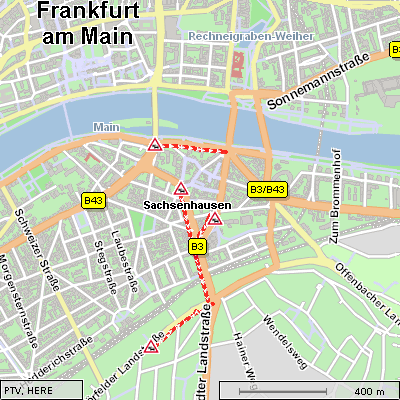
Here you can see two images which illustrate the representation of traffic incidents at different zoom levels.
|
|
|
| "scale": 1000 |
"scale": 150 |
Drawing, Grouping and Hiding PTV_TrafficIncidents Icons
As described above every traffic incident type is assigned to an icon that PTV xMap Server will draw within the specified display range. For an optimum use of drawing space and a self-explanatory meaning the icons are drawn following several rules:
|
|
| Several attributes grouped together |
Visualisation of PTV_TrafficIncidents on the map with changed Style of a given style class
This section describes the visualisation of PTV_TrafficIncidents using a modified Style. The Style is changed in the request by using a changed Profile XML snippet. For more general information on the possibilities for defining Styles, please look at About Feature Layer Rendering.
Below you can find a modified version of the XML snippet which causes the following change:
- Change of colour for blocked roads from grey to black
<Class name="BlockedRoad">
 <Filter>
  <Condition displayClass="IncidentCategory">
   <Range values="51"/>
  </Condition>
 </Filter>
 <Style>
  <Geometry displayRange="9-23">
   <--! Only change the colour, let the other stroke attributes unchanged -->
   <Stroke color="#000000" transparency="20" perpendicularOffset="0" width="90%"/>
   <RenderLevel renderOffset="+10"/>
  </Geometry>
  <Icon displayRange="9-16" url="./22x22/traffic/blocked_road.bmp"/>
  <Icon displayRange="17-19" url="./24x24/traffic/blocked_road.bmp"/>
  <Icon displayRange="20-23" url="./32x32/traffic/blocked_road.bmp"/>
 </Style>
</Class>
As in the example above the JSON sample request below can be directly copied and put into the raw request runner of a PTV xMap server to be tested.
JSON sample Request: Visualise PTV_TruckAttributes on the map
			{
 "mapSection": {
  "$type": "MapSection",
  "center": {
   "$type": "Point",
   "point": {
    "$type": "PlainPoint",
    "x": 964197.28,
    "y": 6455050.52
   }
  },
  "scale": 100,
  "scrollHorizontal": 0,
  "scrollVertical": 0,
  "zoom": 0
 },
 "mapParams": {

  "showScale": true,
  "useMiles": false
 },
 "imageInfo": {
  "format": "GIF",
  "width": 400,
  "height": 400,
  "imageParameter": ""
 },
 "layers": null,
 "includeImageInResponse": true,
 "callerContext": {
  "log1": "$TEST",
  "properties": [
   {
    "key": "CoordFormat",
    "value": "PTV_MERCATOR"
   },
   {
    "key": "ProfileXMLSnippet",
    "value": "<Profile xmlns:xsi=\"http://www.w3.org/2001/XMLSchema-instance\" xsi:noNamespaceSchemaLocation=\"http:///xmap/schema/XMapProfile.xsd\"> <FeatureLayer majorVersion=\"1\" minorVersion=\"0\"> <GlobalSettings enableTimeDependency=\"true\"/> <Themes> <Theme enabled=\"true\" id=\"PTV_TrafficIncidents\"/> </Themes> </FeatureLayer> <Rendering minorVersion='0' majorVersion='1'> <Country id='*'> <Theme id='PTV_TrafficIncidents'> <Class name='BlockedRoad'> <Style> <Geometry displayRange='9-23'> <Stroke color='#000000'/> </Geometry> </Style> </Class> </Theme> </Country> </Rendering> </Profile>"
   },
   {
    "key": "Profile",
    "value": "silkysand"
   },
   {
    "key": "Profile",
	"value": "silkysand"
	}
  ]
 }
}
Here can you see the resulting image:
Copyright © 2025 PTV Logistics GmbH All rights reserved. | Imprint