The feature layer Traffic Patterns is representing a set of speed patterns over time.
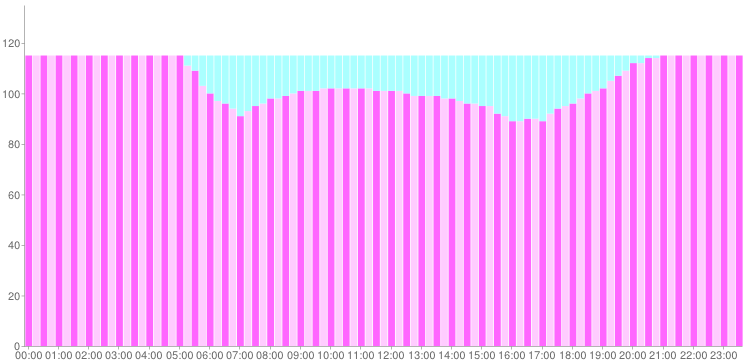
With traffic pattern data the average traffic situation during the week is modelled. This means that using traffic patterns the speeds used for route calculation are time dependent speeds. Speeds for example on mondays or fridays in average are much slower than the speeds on saturdays or sundays. Even the speeds during the day differ between the rush hours (for example 7-9 and 16-18 o'clock) and the night hours (1-5 o'clock). In the picture below a typical traffic patterns over one day is shown representing the speeds a vehicle can drive on a certain street segment of the map at a certain date. A set of many thousands of different traffic patterns for the whole street network is modelled in the PTV_SpeedPatterns theme. Please note that the terms traffic patterns and speed patterns are used synonymously, but you have to use PTV_SpeedPatterns for the theme name. The traffic pattern data is modelled with a so called freeFlowSpeed and a deviation in % relative to the freeflow speed depending on the time layer specific properties.
With traffic pattern data, purchased through licensing the PTV_SpeedPatterns feature layer theme, the user can improve its ETA (Estimated time of arrival) calculation with PTV xRoute Server. By taking into account typical traffic situations like rush hours in the morning and in the evening as well as average inbound and outbound traffic situations around big cities, the calculated ETA will have an increased accuracy. When taking into account traffic patterns in the route calculation the user can choose between two ways of influencing the calculated result by applying certain appropriate ProfileXMLSnippets:
The second use-case can be used to calculate a travel trend for commuters and thus determine the best starting time for a given fixed route.
Additionally the user can easily visualise traffic pattern data on the map using PTV xMap Server by colouring segments according to their level of service (the relative deviation from free flow speed in percent) at a particular date and time. The visualisation of the level of service on the map has the following benefits for the customer:
In order to use the feature layer theme PTV_SpeedPatterns with the PTV xServer, you need to ensure that the following two licence keys include the PTV_SpeedPatterns theme
You can check the license content once the server has been started in the management console.
Find out which service method of PTV xRoute Server supports the PTV_SpeedPatterns feature layer theme.
| service method | PTV_SpeedPatterns |
|---|---|
| calculateRouteInfo | x |
| calculateRoute | x |
| calculateExtendedRoute | x |
| calculateTour | - |
| calculateAdvancedTour | - |
| calculateMatrixInfo | x |
| calculateReachableObjects | x |
| searchForReachableObjects | x |
| calculateIsochrones | x |
Feature layers are designed to provide various additional data to the user. The content depends on the feature layer theme and can be configured via XML profile. In the PTV xRoute server, feature layer data can be requested as generic FeatureDescription element for each route segment.
After successful installation of PTV_SpeedPatterns feature layer data in your map directory just do the following
PTV xRoute Server
ensure that the PTV xRoute has set the map.path key correctly in its PTV xRoute folder/conf/xroute.properties file.
If this is the case the Feature Layer data is automatically initialized on PTV xRoute startup
PTV xMap Server
ensure that PTV xMap has set the map.path key correctly in its PTV xMap folder/conf/xmap.properties file.
If this is the case the Feature Layer data is automatically initialized on PTV xMap startup
The consideration of PTV_SpeedPatterns theme can be done by referencing a specific XML profile or by adding an XML snippet to your request. Both adhere to the structure of the PTV xServer Profiles and can also be combined. Please refer to the technical concept of the Profiles. It explains how XML Profiles and the Profile Snippet Mechanism work in general. A detailed documentation of each PTV xServer Profile Scheme (XSD) is available in the subchapters.
In this section the route calculation taking into account PTV_SpeedPatterns is explained. Below you can find a JSON sample request which can be directly copied and put into the Raw Request Runner of an PTV xRoute Server to be tested.
In this example both, the route path as well as the ETA could be influenced through the use of PTV_SpeedPatterns. But it is notable that often the speeds in the speed pattern data are not varying enough to result in a deviated of route path but only in a difference of the resulting ETA.
Flow:
ProfileXMLSnippet: Enabling FeatureLayer PTV_SpeedPatterns:
<Profile xmlns:xsi='http://www.w3.org/2001/XMLSchema-instance'>
 <FeatureLayer majorVersion='1' minorVersion='0'>
  <!--enable the time dependency because we are using the time dependent PTV_SpeedPatterns theme-->
  <GlobalSettings enableTimeDependency='true'/>
  <Themes>
   <!--enable the PTV_SpeedPatterns theme-->
   <Theme id='PTV_SpeedPatterns' enabled='true'/>
  </Themes>
 </FeatureLayer>
  <Routing majorVersion='2' minorVersion='0'>
   <Course>
    <!--enable additional data rules to enable routing with additional content like feature layer-->
    <AdditionalDataRules enabled='true'/>
    <!--tells the router to take the speeds from PTV_SpeedPatterns data as they are-->
    <!--this means that the speeds from speedPattern data could be inferior to the speeds defined in your vehicle profile-->
    <!--set this parameter to true if you want to limit the speed pattern speeds to those defined in your vehicle profile-->
    <DynamicRouting limitDynamicSpeedToStaticSpeed='false'/>
   </Course>
  </Routing>
</Profile>
{
"waypoints": [
 {
  "coords": [
   {
    "point": {
     "x": 714110,
     "y": 6406752
    }
   }
  ],
   "linkType": "NEXT_SEGMENT"
  },
  {
   "coords": [
    {
     "point": {
      "x": 681583,
      "y": 6371865
     }
    }
   ],
   "linkType": "NEXT_SEGMENT"
  }
 ],
 "options": [
  {
   "parameter": "START_TIME",
   "value": "2014-02-05T08:00:00+02:00"
  }
 ],
  "exceptionPaths": [],
  "details": {
   "binaryPathDesc": false,
   "boundingRectanglesC": 0,
   "boundingRectanglesOffset": 0,
   "brunnelManoeuvres": false,
   "detailLevel": "STANDARD",
   "dynamicInfo": false,
   "manoeuvreAttributes": false,
   "manoeuvreGroups": false,
   "manoeuvres": true,
   "nodes": true,
   "polygon": true,
   "segmentAttributes": false,
   "segments": true,
   "texts": true,
   "totalRectangle": false,
   "urbanManoeuvres": false
  },
  "callerContext": {
   "properties": [
    {
    "key": "CoordFormat",
    "value": "PTV_MERCATOR"
   },
   {
    "key": "ResponseGeometry",
    "value": "WKB"
   },
   {
    "key": "Profile",
    "value": "carfast"
   },
   {
    "key": "ProfileXMLSnippet",
    "value": "<?xml version='1.0' encoding='UTF-8'?><Profile xmlns:xsi='http://www.w3.org/2001/XMLSchema-instance' xsi:noNamespaceSchemaLocation='http://localhost:50030/xroute/schema/XRouteProfile.xsd'><FeatureLayer majorVersion='1' minorVersion='0'><GlobalSettings enableTimeDependency='true'/><Themes><Theme id='PTV_SpeedPatterns' enabled='true'/></Themes></FeatureLayer><Routing majorVersion='2' minorVersion='0'><Course><AdditionalDataRules enabled='true'/><DynamicRouting limitDynamicSpeedToStaticSpeed='false'/></Course></Routing></Profile>"
   }
  ]
 }
}
This section describes the general flow how to visualise PTV_SpeedPatterns on the map.
Subsequent visualisation examples are just using different Profile XML Snippets - each of them described below - but following the same general Flow
Flow:
ProfileXMLSnippet: Enabling Feature Layer PTV_SpeedPatterns
<Profile xmlns:xsi='http://www.w3.org/2001/XMLSchema-instance'>
 <FeatureLayer majorVersion='1' minorVersion='0'>
  <!--enable the time dependency because we are using the time dependent PTV_SpeedPatterns theme-->
  <GlobalSettings enableTimeDependency='true'/>
  <Themes>
  <!--enable the PTV_SpeedPatterns theme-->
   <Theme id='PTV_SpeedPatterns' enabled='true'/>
   </Themes>
 </FeatureLayer>
</Profile>
The following section shows the default rendering settings of the PTV_SpeedPatterns feature layer. These settings are displayed and summarised with the associated XML snippets. Please refer to About Feature Layer Rendering for an overview of all rendering possibilities.
<Class name="HeavyTrafficOnMainRoad">
 <Filter>
  <Condition displayClass="LevelOfService" streetType="MOTORWAY_FREEWAY">
   <Range values="0-50">
  </Condition>
 </Filter>
 <Style>
  <Geometry displayRange="0-23">
   <RenderLevel renderOffset="-1"/>
   <Stroke color="#FF0000" transparency="0" perpendicularOffset="80%" width="160%"/>
  </Geometry>
 </Style>
</Class>
<Class name="DenseTrafficOnMainRoad">
 <Filter>
  <Condition displayClass="LevelOfService" streetType="MOTORWAY_FREEWAY">
   <Range values="51-70"/>
  </Condition>
 </Filter>
 <Style>
  <Geometry displayRange="0-23">
   <RenderLevel renderOffset="-1"/>
   <Stroke color="#F7A20E" transparency="0" perpendicularOffset="80%" width="160%"/>
  </Geometry>
 </Style>
</Class>
<Class name="NormalTrafficOnMainRoad">
 <Filter>
  <Condition displayClass="LevelOfService" streetType="MOTORWAY_FREEWAY">
   <Range values="71-101"/>
  </Condition>
 </Filter>
 <Style>
  <Geometry displayRange="0-23">
   <RenderLevel renderOffset="-1"/>
   <Stroke color="#F38AA0E" transparency="50" perpendicularOffset="80%" width="160%"/>
  </Geometry>
 </Style>
</Class>
PTV_SpeedPatterns distinguish between higher-level streets (highways) and lower-level ones (city roads). Above is the section for higher-level streets. PTV_SpeedPatterns are categorised into three classes based on the current speed (Range values="0-50", "51-70", "71-101"): HeavyTraffic-, DenseTraffic- and NormalTrafficOnMainNetwork. They are displayed as an offset line (perpendicularOffset="80%") and differ only in the display colour (Heavy=red, Dense=orange and Normal=green)
<Class name="HeavyTrafficOnLowNetwork">
 <Filter>
  <Condition displayClass="LevelOfService" streetType="URBAN_STREET">
   <Range values="0-50"/>
  </Condition>
  <Condition displayClass="LevelOfService" streetType="LOCAL_MNOR_ROAD">
   <Range values="0-50"/>
  </Condition>
  <Condition displayClass="LevelOfService" streetType="LOCAL_MAJOR_ROAD">
   <Range values="0-50"/>
  </Condition>
  <Condition displayClass="LevelOfService" streetType="SINGLE_CARRIAGE_HIGHWAY">
   <Range values="0-50"/>
  </Condition>
  <Condition displayClass="LevelOfService" streetType="DUAL_CARRIAGE_HIGHWAY">
   <Range values="0-50"/>
  </Condition>
 </Filter>
 <Style>
  <Geometry displayRange="14-23">
   <RenderLevel renderOffset="-1"/>
   <Stroke color="#FF0000" transparency="0" perpendicularOffset="80%" width="120%"/>
  </Geometry>
 <Style>
</Class>
For low-level streets, the classification is identical. Here therefore, for example, only the HeavyTrafficOnLowNetwork class is described. This differs from HeavyTrafficOnMainNetwork only in terms of the width of the line (width="120%"). The remaining settings are the same.
Be aware that a changed zoom level at DisplayRange can cause loss of performance!
Below you can find a JSON sample request which can be directly copied and put into the raw request runner of an PTV xMap to be tested.
{
 "mapSection": {
  "$type": "MapSection",
  "center": {
   "$type": "Point",
   "point": {
    "$type": "PlainPoint",
    "x": 681142,
    "y": 6369874
   }
  },
  "scale": 1000,
  "scrollHorizontal": 0,
  "scrollVertical": 0,
  "zoom": 0
 },
 "mapParams": {
  "referenceTime": "2014-02-05T08:00:00+02:00",
  "showScale": true,
  "useMiles": false
 },
 "imageInfo": {
  "format": "GIF",
  "width": 400,
  "height": 400,
  "imageParameter": ""
 },
 "layers": null,
 "includeImageInResponse": true,
 "callerContext": {
  "log1": "$TEST",
  "properties": [
   {
    "key": "CoordFormat",
    "value": "PTV_MERCATOR"
   },
   {
    "key": "ProfileXMLSnippet",
    "value": "<Profile xmlns:xsi='http://www.w3.org/2001/XMLSchema-instance'><FeatureLayer majorVersion='1' minorVersion='0'> <GlobalSettings enableTimeDependency='true'/> <Themes> <Theme id='PTV_SpeedPatterns' enabled='true'/> </Themes> </FeatureLayer></Profile>"
   }
  ]
 }
}.
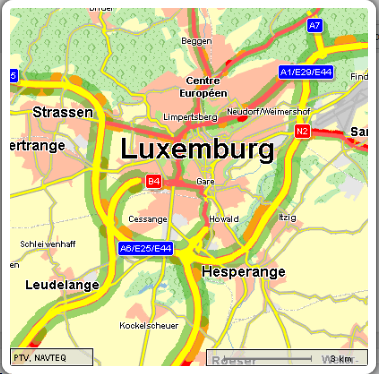
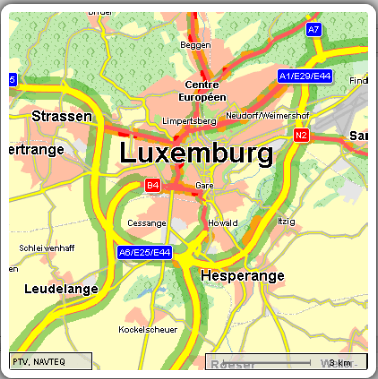
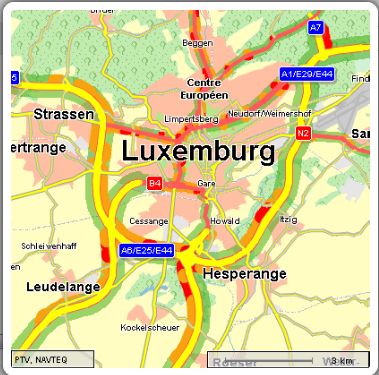
Below you can see 3 pictures illustrating the different levels of service at different dates during a normal weekday in Luxemburg:
|
|
|
| "referenceTime": "2014-02-05T08:00:00+02:00" | "referenceTime": "2014-02-05T12:00:00+02:00" | "referenceTime": "2014-02-05T18:00:00+02:00" |
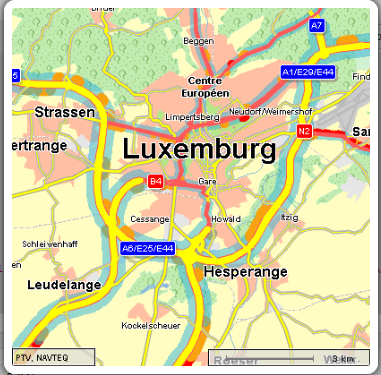
This section describes how to visualise PTV_SpeedPatterns on the map using a changed style. The changed style is defined in the request by using an appropriate ProfileXMLSnippet. For the general concept how to define your own styles or redefine existing styles please refer to the technical concept of Feature Layer Rendering capabilities here About Feature Layer Rendering..
Below you find the annotated snippet used in the example request hereafter which changes the following.
<Profile xmlns:xsi='http://www.w3.org/2001/XMLSchema-instance'>
 <FeatureLayer majorVersion='1' minorVersion='0'>
  <GlobalSettings enableTimeDependency='true'/>
  <Themes>
   <Theme id='PTV_SpeedPatterns' enabled='true'/>
  </Themes>
 </FeatureLayer>
 <Rendering minorVersion='0' majorVersion='1'>
  <Country id='*'>
   <Theme id='PTV_SpeedPatterns'>
    <!--reference the style class named "NormalTrafficOnMainNetwork" defined in default.xml shipped with the PTV xMap-->
    <Class name='NormalTrafficOnMainNetwork'>
     <!--omit the Filter element because we do not want to change the filter settings-->
     <Style>
      <!--be sure to choose the same DisplayRange as defined in the default.xml for the referenced class "NormalTrafficOnMainNetwork"-->
      <!--otherwise PTV xMap will throw an exception-->
      <Geometry displayRange='ALWAYS'>
       <!--only change the color, let the other Stroke attributes unchanged-->
       <Stroke color='#30B4DB'/>
      </Geometry>
     </Style>
    </Class>
   </Theme>
  </Country>
 </Rendering>
</Profile>
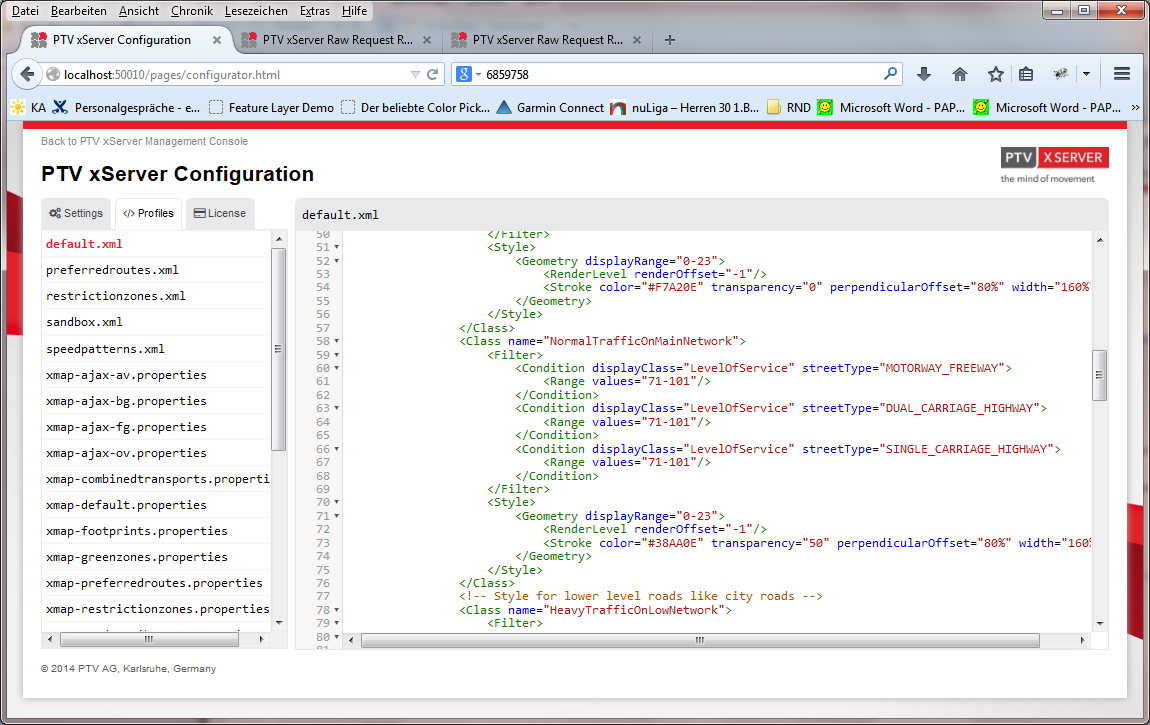
How to know particular class names defined in the default.xml which is shipped with xMap Server?
To get known the predefined style class name of a certain feature layer theme you can look in the PTV xServer Configuration reachable through PTV xServer Administration Console.
As in the examples above the JSON sample request below can be directly copied and put into the raw request runner of an PTV xMap to be tested.
{
 "mapSection": {
  "$type": "MapSection",
  "center": {
   "$type": "Point",
   "point": {
    "$type": "PlainPoint",
    "x": 681142,
    "y": 6369874
   }
  },
  "scale": 1000,
  "scrollHorizontal": 0,
  "scrollVertical": 0,
  "zoom": 0
 },
 "mapParams": {
  "referenceTime": "2014-02-05T08:00:00+02:00",
  "showScale": true,
  "useMiles": false
 },
 "imageInfo": {
  "format": "GIF",
  "width": 400,
  "height": 400,
  "imageParameter": ""
 },
 "layers": null,
 "includeImageInResponse": true,
 "callerContext": {
  "log1": "$TEST",
  "properties": [
   {
    "key": "CoordFormat",
    "value": "PTV_MERCATOR"
   },
   {
    "key": "ProfileXMLSnippet",
    "value": "<Profile xmlns:xsi='http://www.w3.org/2001/XMLSchema-instance'> <FeatureLayer majorVersion='1' minorVersion='0'> <GlobalSettings enableTimeDependency='true'/> <Themes> <Theme id='PTV_SpeedPatterns' enabled='true'/> </Themes> </FeatureLayer> <Rendering minorVersion='0' majorVersion='1'> <Country id='*'> <Theme id='PTV_SpeedPatterns'> <Class name='NormalTrafficOnMainNetwork'> <Style> <Geometry displayRange='ALWAYS'> <Stroke color='#30B4DB'/> </Geometry> </Style> </Class> </Theme> </Country> </Rendering></Profile>"
   }
  ]
 }
}
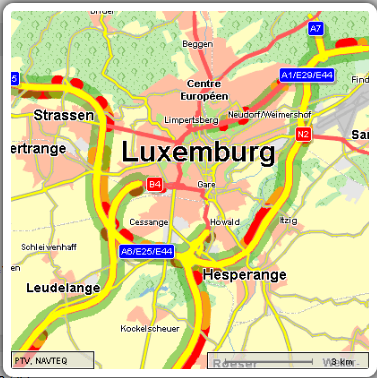
This section describes how to visualise PTV_SpeedPatterns on the map using a changed filter. The changed filter is defined in the request by using an appropriate ProfileXMLSnippet. For the general concept how to define your own filters or redefine existing filters please refer to the technical concept of Feature Layer Rendering capabilities in About Feature Layer Rendering. Below you find the annotated snippet used in the example request hereafter which changes the filter conditions of the style class NormalTrafficOnMainNetwork in order to
ProfileXMLSnippet: Change filter for visualisation of a certain style class
<Profile xmlns:xsi='http://www.w3.org/2001/XMLSchema-instance'>
 <FeatureLayer majorVersion='1' minorVersion='0'>
  <GlobalSettings enableTimeDependency='true'/>
  <Themes>
   <Theme id='PTV_SpeedPatterns' enabled='true'/>
  </Themes>
 </FeatureLayer>
 <Rendering minorVersion='0' majorVersion='1'>
  <Country id='*'>
   <Theme id='PTV_SpeedPatterns'>
    <!--reference the style class named "NormalTrafficOnMainNetwork" defined in default.xml shipped with the PTV xMap-->
    <Class name='NormalTrafficOnMainNetwork'>
     <!--set the reset attribute of the filter to true in order to completely redefine the filter of style class NormalTrafficOnMainNetwork
     <Filter reset='true'>
      <!--Note that the filter redefinition includes only one single Condition element defining a modified Range for displayClass LevelOfService-->
      <!--the filter is now limited to the streetType MOTORWAY_FREEWAY exclusively-->
      <Condition displayClass='LevelOfService' streetType='MOTORWAY_FREEWAY'>
       <Range values='0-70'/>
      </Condition>
     </Filter>
     <!--omit the Style element because we do not want to change the styles settings-->
    </Class>
    <!--...do the same with the other 2 style classes which should be redefined-->
    <Class name='DenseTrafficOnMainNetwork'>
     <Filter reset='true'>
      <Condition displayClass='LevelOfService' streetType='MOTORWAY_FREEWAY'>
       <!--take care of non-overlapping ranges!-->
       <Range values='71-80'/>
      </Condition>
     </Filter>
    </Class>
    <Class name='NormalTrafficOnMainNetwork'>
     <Filter reset='true'>
      <Condition displayClass='LevelOfService' streetType='MOTORWAY_FREEWAY'>
       <Range values='81-101'/>
     </Filter>
    </Class>
   </Theme>
  </Country>
 </Rendering>
</Profile>
Hereafter the JSON sample request can be found to be directly tested in the raw request runner of a PTV xMap Server.
{
 "mapSection": {
  "$type": "MapSection",
  "center": {
   "$type": "Point",
   "point": {
     "$type": "PlainPoint",
     "x": 681142,
     "y": 6369874
   }
  },
  "scale": 1000,
  "scrollHorizontal": 0,
  "scrollVertical": 0,
  "zoom": 0
 },
 "mapParams": {
  "referenceTime": "2014-02-05T08:00:00+02:00",
  "showScale": true,
  "useMiles": false
 },
 "imageInfo": {
  "format": "GIF",
  "width": 400,
  "height": 400,
  "imageParameter": ""
 },
 "layers": null,
 "includeImageInResponse": true,
 "callerContext": {
  "log1": "$TEST",
  "properties": [
   {
    "key": "CoordFormat",
    "value": "PTV_MERCATOR"
   },
   {
   "key": "ProfileXMLSnippet",
 "value": "<Profile xmlns:xsi='http://www.w3.org/2001/XMLSchema-instance'>
   <FeatureLayer majorVersion='1' minorVersion='0'>
   <GlobalSettings enableTimeDependency='true'/> <Themes>
   <Theme id='PTV_SpeedPatterns' enabled='true'/> </Themes>
   </FeatureLayer><Rendering minorVersion='0' majorVersion='1'>
   <Country id='*'> <Theme id='PTV_SpeedPatterns'>
   <Class name='HeavyTrafficOnMainNetwork'> <Filter reset='true'>
   <Condition displayClass='LevelOfService' streetType='MOTORWAY_FREEWAY'>
   <Range values='0-70'/> </Condition> </Filter> </Class>
   <Class name='DenseTrafficOnMainNetwork'> <Filter reset='true'>
   <Condition displayClass='LevelOfService' streetType='MOTORWAY_FREEWAY'>
   <Range values='71-80'/> </Condition> </Filter> </Class>
   <Class name='NormalTrafficOnMainNetwork'> <Filter reset='true'>
   <Condition displayClass='LevelOfService' streetType='MOTORWAY_FREEWAY'>
   <Range values='81-101'/> </Condition> </Filter> </Class>
   </Theme> </Country> </Rendering> </Profile>"
   }
  ]
 }
 }
The resulting image below shows that modified visualisation ranges of LevelOfService
Copyright © 2025 PTV Logistics GmbH All rights reserved. | Imprint