Additional geographic data such as points of interest or areas can be displayed on the map using the SMOLayer. Just enter the layer's name and the name of the database configuration which is represented by a file <configuration>-geodatasource.xml in the conf-folder of PTV xMap Server.
The mechanism works as follows. The data to be displayed is imported from the database, enriched with style information and then displayed by PTV xMap Server.
The VisibleSection element of the response returns information of the map to the client comprising the map's minimum bounding rectangle (bounding box), its center and the scale. When using the renderMapRot service it also consists of the map angle and the geographic co-ordinates of the four corners of the map image.
| xg = xp * (box.right - box.left) / width + box.left |
| yg = (height - yp) * (box.top - box.bottom) / height + box.bottom |
This only works if the image is not rotated and the co-ordinate format used is Mercator. When using other co-ordinate formats such as geodecimal, which does not conform with Mercator, the result will not be correct. The following image shows a linear interpolation with Mercator co-ordinates, where the interpolated center point is in the center of the map:
![]()
When using geodecimal co-ordinates, the interpolated center point is not in the center of the map:
![]()
Consequently, transform geodecimal co-ordinates to Mercator before interpolation and transform the interpolated co-ordinates back to geodecimal, in order to implement interpolation.
The bounding box equals the geographic area displayed on the map if and only if the map is not rotated. Otherwise the bounding box is larger than the area displayed, and it is defined as the minimum rectangle containing the whole map image.
Let the following image be the initial image:
Rotating the image yields the following image:
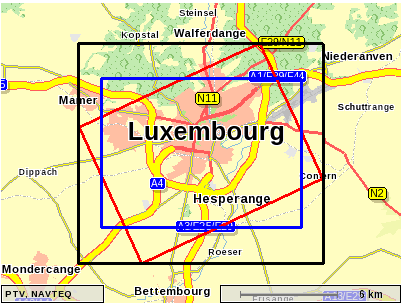
Please note that interpolating the geographic co-ordinates from pixel points is not possible in this case.
Combined transport is a function to add ferries or piggybacks to the route planning as additional stations. Ferries and piggy back stations are displayable as a StaticPoiLayer that is named combined transports. Please note that combined transports are supported only by maps 2012.1 or newer.
![]()
![]()
The type of representation is configured in the CombinedTransportLayer section in render.ini file located in the conf folder of PTV xMap Server:
[CombinedTransportLayer]
;
; Each of the following parameters contains a list of values:
; The values for ferries can be found in the first column
; the values for piggyback transports can be found in the second column
;
; images are drawn below this scale.
scale=100.0,200.0
;
; Enable/disable the autoplacement.
autoplacementEnabled=true,true
;
; If true the images will only be drawn, if there is enough space.
; If false the images will always be drawn.
autoplacementDontForcePaint=false,false
;
; Number of steps to try to find a position for the image.
autoplacementStepSize=4,4
;
; The maximal distance in pixels to displace the image.
autoplacementMaxDistance=24,24
;
; The additional space that is reserved in the place reservation.
autoplacementAdditionalSpace=-4,-4
;
; The pin type.
; 0 for no pin, 1 for an arrow, 2 for a line.
autoplacementPinType=1,1
;
; The pin color.
autoplacementPinColor=2829311,2829311
The layer is able to return object information as a description string. This string contains the combined transport layer type followed by key-value pairs. The delimiter of the key-value pairs is $$:
| key | value | description |
|---|---|---|
| ID | - | identification of the combined transport |
| START_NAME | string | place name of the start of the combined transport |
| DEST_NAME | string | name of the destination of the combined transport |
| NAME | string | name of the combined transport |
| DURATION | integer | duration of the transit in seconds |
| CAR | 0,1 | flag that indicates that the combined transport is blocked for car |
| VAN | 0,1 | flag that indicates that the combined transport is blocked for vans |
| TRU | 0,1 | flag that indicates that the combined transport is blocked for trucks |
| COM | 0,1 | flag that indicates that the combined transport is blocked for combustible goods transports |
| HAZ | 0,1 | flag that indicates that the combined transport is blocked for hazardous goods transports |
| MOT | 0,1 | flag that indicates that the combined transport is blocked for motorcycles |
| BIK | 0,1 | flag that indicates that the combined transport is blocked for bicycles |
| CAM | 0,1 | flag that indicates that the combined transport is blocked for campers |
| BUS | 0,1 | flag that indicates that the combined transport is blocked for buses |
| PED | 0,1 | flag that indicates that the combined transport is blocked for pedestrians |
| DEST_COORD | x,y | the coordinates of the destination |
An example of an object information description looks like this:
2#ID=VjEoMzM7MTA4NDU3NzA1MDsyOzE2MzswKSgzMzsxMDg0NTExNTE0OzE5ODs2ODswKVR1bm5lbCBTb3VzIGxhIE1hb
mNoZQ==$$START_NAME=$$DEST_NAME=$$NAME=Tunnel Sous la
Manche$$DURATION=1201$$CAR=0$$VAN=0$$TRU=0$$COM=1$$HAZ=1$$MOT=1$$BIK
    =0$$CAM=1$$BUS=0$$PED=0$$DEST_COORD=201298,6599539
Road attributes like FREE_FOR_DELIVERY, FREE_FOR_EMERGENCY, BLOCKED_IN_WINTER, RESIDENTCAR and RESIDENTTRUCK are displayable as a StaticPoiLayer that is named roadattributes.
The type of representation is configured in render.ini file located in the conf folder of PTV xMap Server:
[VersionRoutingFlagVisualization]
Version=1.0.0
;   Settings for segments with several Routing Flags
;   The following properties are configurable:
;   -----------------------------------------
;   FillColor:
;     Defines the color as long integer in rgb
;     format. The lowest 8 bits give the red part,
;     the next 8 bits give the green part and the
;     highest 8 bits give the blue part of the
;     color.
;   MaximumScale:
;     Maximum scale factor to draw a segment. If
;     the map scale factor is greater that this
;     maximum, the segment is not drawn.
;   WidthInPercent:
;      Declaration in the value range from 1 % to 100 %.
;      Subtraction from the segment width in percent.
;      0% means all lines are displayed with one pixel width.
;     100% means all lines are displayed with the full width from the segment.
;     First example: The segment width is 20 pixel.
;     The value for width is 20 %.
;     20 % from 20 Pixel are 4 pixel.
;     This make 4 pixel for the routing flag line.
;     Second example: The segment width is 80 pixel.
;     The value for width is 80 %.
;     80 % from 20 Pixel are 16 pixel.
;     This make 16 pixel for the routing flag line.
;
; For segments with more than one routing flag.
[RoutingFlag.Combined]
FillColor=10526880
MaximumScale=1.000000
WidthInPercent=50
[RoutingFlag.FreeForDelivery]
FillColor=10526880
MaximumScale=1.000000
WidthInPercent=50
[RoutingFlag.FreeForEmergency]
FillColor=10526880
MaximumScale=1.000000
WidthInPercent=50
[RoutingFlag.BlockedInWinter]
FillColor=10526880
MaximumScale=1.000000
WidthInPercent=50
[RoutingFlag.ResidentCar]
FillColor=10526880
MaximumScale=1.000000
WidthInPercent=50
[RoutingFlag.ResidentTruck]
FillColor=10526880
MaximumScale=1.000000
WidthInPercent=50
The layer is able to return object information as a description string. This string contains the road attributes as key-value pairs. The delimiter of the key-value pairs is $$:
An example of an object information description looks like this:
FREE_FOR_DELIVERY=0$$FREE_FOR_EMERGENCY=0$$BLOCKED_IN_WINTER=0$$RESIDENTCAR=0$$RESIDENTTRUCK=1
Many layout parameters cannot be modified by the request, but only by the map profile which is configured in the profile's properties file. This properties file is called xmap-profilename.properties. Its key map.profile can reference an ini file which contains all layout parameters.
As an example PTV xMap Server comes with the following map profiles:
To view both, the building footprints and the greenzones, create a new map profile combining all keys from both of the existing map profiles.
Please see the following documents for more information.
The XML schema:
<?xml version="1.0" encoding="utf-8"?>
<soap:Envelope xmlns:soap="http://schemas.xmlsoap.org/soap/envelope/"
 xmlns:xsi="http://www.w3.org/2001/XMLSchema-instance"
   xmlns:xsd="http://www.w3.org/2001/XMLSchema">
   <soap:Body>
     <calculateRoute xmlns="http://types.xroute.xserver.ptvag.com">
       <ArrayOfWaypointDesc_1>
         <WaypointDesc fuzzyRadius="0" linkType="NEXT_SEGMENT"
           xmlns="http://xroute.xserver.ptvag.com">
           <wrappedCoords>
             <Point
               xmlns="http://common.xserver.ptvag.com">
               <point x="681766" y="6370195" />
             </Point>
           </wrappedCoords>
           <nodeID xsi:nil="true" />
           <wrappedSegmentID xsi:nil="true" />
         </WaypointDesc>
         <WaypointDesc fuzzyRadius="0" linkType="NEXT_SEGMENT"
       xmlns="http://xroute.xserver.ptvag.com">
       <wrappedCoords>
         <Point
           xmlns="http://common.xserver.ptvag.com">
           <point x="681925" y="6366111" />
         </Point>
       </wrappedCoords>
       <nodeID xsi:nil="true" />
       <wrappedSegmentID xsi:nil="true" />
     </WaypointDesc>
    </ArrayOfWaypointDesc_1>
    <ArrayOfRoutingOption_2>
     <RoutingOption parameter="GEODATASOURCE_LAYER"
       value="default.traffic" xmlns="http://xroute.xserver.ptvag.com" />
    </ArrayOfRoutingOption_2>
   <ArrayOfExceptionPath_3 />
   <ResultListOptions_4 binaryPathDesc="true"
      boundingRectanglesC="5" boundingRectanglesOffset="300"
     brunnelManoeuvres="false" detailLevel="STANDARD" dynamicInfo="false"
     manoeuvreAttributes="false" manoeuvreGroupRatio="1"
     manoeuvreGroups="true" manoeuvres="true" nodes="false"
     polygon="true" segmentAttributes="false" segments="true"
     texts="true" totalRectangle="true" urbanManoeuvres="false">
     <destDetail xsi:nil="true"
       xmlns="http://xroute.xserver.ptvag.com" />
     <emissions xsi:nil="true"
       xmlns="http://xroute.xserver.ptvag.com" />
     <startDetail xsi:nil="true"
       xmlns="http://xroute.xserver.ptvag.com" />
     </ResultListOptions_4>
     <CallerContext_5>
       <wrappedProperties
         xmlns="http://baseservices.service.jabba.ptvag.com">
         <CallerContextProperty key="ResponseGeometry"
           value="PLAIN" />
           <CallerContextProperty key="CoordFormat"
             value="PTV_MERCATOR" />
           <CallerContextProperty key="Profile"
              value="carfast" />
       </wrappedProperties>
     </CallerContext_5>
   </calculateRoute>
 </soap:Body>
</soap:Envelope>
Copyright © 2025 PTV Logistics GmbH All rights reserved. | Imprint