After carrying out a territory planning or a location assignment, it is worth analysing and evaluating the results. To this end, PTV xTerritory provides a variety of result lists and statistical data which can be displayed using PTV xMap, for example.
Get information about the result lists and territory planning data that PTV xTerritory will provide alongside the planning.
Receive examples of ways to visually present your territory planning.
Result(s) of a territory planning with the PTV xTerritory server
PTV xMap server basic skills
The aim of territory planning is to provide assignments of locations to new or existing territories. The result list can, depending on the configuration, contain a list of locations with assignments to the territories (locations) and an area list with assignments to the locations (territories).
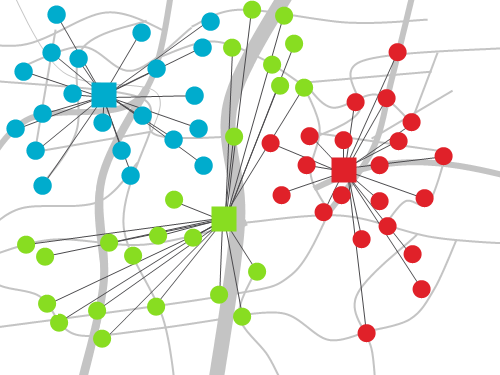
You can represent the assignment of locations to a territory by showing the objects in the same color, for example. If the territory center for a territory also needs to be represented visually, using the same color is a good solution - but using a different symbol for the center.
Simply assigning locations to territories does not, however, provide much information about the quality of the result. As has already been set out in the basics (How to plan Territories), territory planning has two main target criteria: the contiguity/compactness of territories and equality in the amounts of activity.
This target criterion can often be split into two sub-aspects: while on the one hand, the contiguity/compactness of the territories naturally impacts planning-wise on travel times and thus on the efficiency of territories, the "visual" effect of territory planning often plays a major role in this arena.
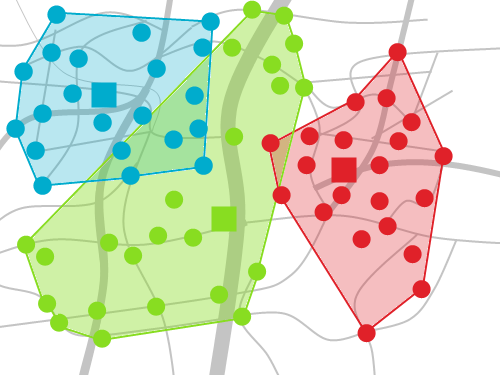
Contiguity: contiguity is present if the locations in a territory are geographically linked, meaning that there are no overlaps when territories are depicted visually.
Compactness: territories are perceived as visually "attractive" when they are as circular as possible with minimal distortion.
The territory planning algorithms are always designed with a view to maximising compactness and contiguity as far as possible. The less complex the "terms and conditions", the more achievable this aim becomes. A distribution of activity levels which is as homogeneous as possible, a uniform road network or planning 'as the crow flies', few fixed assignments and a high tolerance threshold produce the most "visually attractive" territories. In every case, contiguity and compactness are in competition with the restrictions - especially where the evenness of territories is concerned.
The "shape" of territories can be represented with the assistance of assignment lines or geometric depiction of the areas. Both modes of representation are well suited to aiding visualisation, especially with large-scale territory plannings which can push the number of possible color nuances to its limits. Representing territories using their area brings out contiguity and compactness most strongly: a useful function when visualising and looking to optimise the current state of a territory planning. If, however, the territories are planned according to the road network or if restrictions mean that they are not round and compact in shape, geometric representation of the regions in particular is less suitable. Instead, it is advisable to connect individual locations with their territory centres using lines, to create a network of lines.
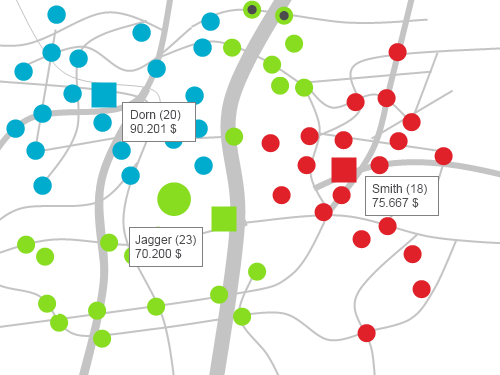
Furthermore, PTV xTerritory server provides statistical data on individual planned territories. A summary of each individually planned territory (TerritorySummary) contains the number of assigned locations and the total activity for all locations. The data can, for example, be displayed as a label on each territory. Planning information that is relevant to individual areas can be depicted using available PTV xMap server methods, e.g. territorial coverage and activity (labels), fixed assignments (black dot), high levels of activity (size of symbol).
Visualisation requires a configured PTV xMap server with a digital map of the relevant area and the corresponding licenses.
The necessary steps are illustrated with the help of a C# sample.
Initialisation: create an xMap client object and initialise the object image.
//Step 1: Create xMap client
XMapWSService client = new XMapWSService();

//Step 2: Create ImageInfo
ImageInfo imageInfo = new ImageInfo
{
  format = ImageFileFormat.PNG,
  height = 800,
  width = 1280,
  imageParameter = ""
};

//Step 3: Create MapParams
MapParams mapParams = new MapParams
{
  showScale = true,
  useMiles = false
};
Copy the data: Create Bitmap arrays for locations and territories and complete them with data from the PTV xTerritory server response.
//Step 4.1: Create Bitmap array for locations, each location will be visualised with a bitmap marker
Bitmap[] bitmapArrayLocations = new Bitmap[territories.wrappedLocations.Length];

//Step 4.2: Create Bitmap array for territory centres, each center will be visualised with a bitmap marker
Bitmap[] bitmapArrayTerritories = new Bitmap[territories.wrappedTerritories.Length];

int locationCounter = 0;
int territoryCounter = 0;

//Step 5.1: Create list of territoryIDs, it will be used to match with the territoryIDs of the locations
List<String> territoryIDs = new List<String>();

//Step 6: Fill list and dictionary, add territory centres to bitmap array
//        Add textual information about the territories into a text array
Text[] districtInfos = new Text[territories.wrappedTerritories.Length];
foreach (Territory ter in territories.wrappedTerritories)
{
  territoryIDs.Add(ter.id);
  String bmp = "dealer.bmp";
  xserver.Point point = ter.referencePoint;
  bitmapArrayTerritories[territoryCounter] = new Bitmap
  {
    name = bmp,
    position = point
  };
  String districtInfo = "Territory ID: " + ter.id + "\n" + "Total activity: " + ter.summary.totalActivity + "\n" + "Number of locations: " + ter.summary.numberOfLocations;
  districtInfos[territoryCounter] = new Text
  {
    position = ter.referencePoint,
    text = districtInfo
  };
  territoryCounter++;
}

//Step 7: Add locations to bitmap array
foreach (Location location in territories.wrappedLocations)
{
  String bmp = "location.bmp";
  if (location.territoryId == territoryIDs[0])
  {
    bmp = "flaggreen.bmp";
  }
  else if (location.territoryId == territoryIDs[1])
  {
     bmp = "flagred.bmp";
  }
  else if (location.territoryId == territoryIDs[2])
  {
    bmp = "flagblue.bmp";
  }
  xserver.Point point = location.coordinate;
  bitmapArrayLocations[locationCounter] = new Bitmap
  {
    name = bmp,
    position = point
  };

  locationCounter++;
}
Create xMap layers: Create CustomLayers for the bitmaps and parametrise the layer object.
//Step 8: Create BitmapOptions (one for territories, one for locations) and Bitmaps arrays
[...]
Bitmaps[] bitmaps = new Bitmaps[]
{
  new Bitmaps { wrappedBitmaps = bitmapArrayLocations, options = bitmapOptionsLocations },
  new Bitmaps { wrappedBitmaps = bitmapArrayTerritories, options = bitmapOptionsTerritories }
};

//Step 9: Create CustomLayer for bitmaps
CustomLayer customBMPLayer = new CustomLayer
{
  centerObjects = true,
  drawPriority = 25002,
  name = "ObjectLayer",
  objectInfos = ObjectInfoType.REFERENCEPOINT,
  visible = true,
  wrappedBitmaps = bitmaps
};

// Step 10: Choose appropriate font
[...]

// Step 11: Set text options
[...]

// Step 12: Create texts array
[...]

// Step 13: Define customLayer and set the texts visible
CustomLayer textLayer = new CustomLayer
{
  drawPriority = 25001,
  name = "Text layer",
  objectInfos = ObjectInfoType.REFERENCEPOINT,
  visible = true,
  wrappedTexts = texts
};

//Step 14: Add all CustomLayers (bitmaps and texts) to a Layer array
Layer[] layers = new Layer[2];
layers[0] = customBMPLayer;
layers[1] = textLayer;
Send xMap request: send xMap request (renderMap) and display the return image.
bool includeImageInResponse = false;

try
{
  // Step 15: Return map object with its characteristics


  Map map = client.renderMap(null, mapParams, imageInfo, layers, includeImageInResponse, null);

  // Step 16: Retrieve image
  String imageUrl = "http://" + map.image.url;

  // Create BitmapImage
  BitmapImage bitmapImage = new BitmapImage();

  // Display BitmapImage
  bitmapImage.BeginInit();
  bitmapImage.UriSource = new Uri(imageUrl);
  bitmapImage.EndInit();

  img1.Source = bitmapImage;
}
catch (Exception e)
{
    [...]
}
private void displayTerritories(ref Territories territories)
{
  //Step 1: Create xMap client
  XMapWSService client = new XMapWSService();

  //Step 2: Create ImageInfo
  ImageInfo imageInfo = new ImageInfo
  {
      format = ImageFileFormat.PNG,
      height = 800,
      width = 1280,
      imageParameter = ""
  };

  //Step 3: Create MapParams
  MapParams mapParams = new MapParams
  {
      showScale = true,
      useMiles = false
  };

  //Step 4.1: Create Bitmap array for locations, each location will be visualised with a bitmap marker
  Bitmap[] bitmapArrayLocations = new Bitmap[territories.wrappedLocations.Length];

  //Step 4.2: Create Bitmap array for territory centres, each center will be visualised with a bitmap marker
  Bitmap[] bitmapArrayTerritories = new Bitmap[territories.wrappedTerritories.Length];

  int locationCounter = 0;
  int territoryCounter = 0;

  //Step 5.1: Create list of territoryIDs, it will be used to match with the territoryIDs of the locations
  List<String> territoryIDs = new List<String>();

  //Step 6: Fill list and dictionary, add territory centres to bitmap array
  //        Add textual information about the territories into a text array
  Text[] districtInfos = new Text[territories.wrappedTerritories.Length];
  foreach (Territory ter in territories.wrappedTerritories)
  {
      territoryIDs.Add(ter.id);
      String bmp = "dealer.bmp";
      xserver.Point point = ter.referencePoint;
      bitmapArrayTerritories[territoryCounter] = new Bitmap
      {
          name = bmp,
          position = point
      };
      String districtInfo = "Territory ID: " + ter.id + "\n" + "Total activity: " + ter.summary.totalActivity + "\n" + "Number of locations: " + ter.summary.numberOfLocations;
      districtInfos[territoryCounter] = new Text
      {
          position = ter.referencePoint,
          text = districtInfo
      };
      territoryCounter++;
  }

  //Step 7: Add locations to bitmap array
  foreach (Location location in territories.wrappedLocations)
  {
      String bmp = "location.bmp";
      if (location.territoryId == territoryIDs[0])
      {
          bmp = "flaggreen.bmp";
      }
      else if (location.territoryId == territoryIDs[1])
      {
          bmp = "flagred.bmp";
      }
      else if (location.territoryId == territoryIDs[2])
      {
          bmp = "flagblue.bmp";
      }
      xserver.Point point = location.coordinate;
      bitmapArrayLocations[locationCounter] = new Bitmap
      {
          name = bmp,
          position = point
      };

      locationCounter++;
  }

  //Step 8: Create BitmapOptions (one for territories, one for locations) and Bitmaps arrays
  BitmapOptions bitmapOptionsLocations = new BitmapOptions
  {
      referencePoint = new PlainPoint { x = 25, y = 32 },
      transparencyColor = new xserver.Color { red = 255, green = 255, blue = 255 }
  };
  BitmapOptions bitmapOptionsTerritories = new BitmapOptions
  {
      referencePoint = new PlainPoint { x = 12, y = 12 },
      transparencyColor = new xserver.Color { red = 255, green = 255, blue = 255 }
  };
  Bitmaps[] bitmaps = new Bitmaps[]
  {
      new Bitmaps { wrappedBitmaps = bitmapArrayLocations, options = bitmapOptionsLocations },
      new Bitmaps { wrappedBitmaps = bitmapArrayTerritories, options = bitmapOptionsTerritories }
  };

  //Step 9: Create CustomLayer for bitmaps
  CustomLayer customBMPLayer = new CustomLayer
  {
      centerObjects = true,
      drawPriority = 25002,
      name = "ObjectLayer",
      objectInfos = ObjectInfoType.REFERENCEPOINT,
      visible = true,
      wrappedBitmaps = bitmaps
  };

  // Step 10: Choose appropriate font
  Font districtFont = new Font
  {
      name = "Arial",
      size = 12,
      bold = true,
  };

  // Step 11: Set text options
  xserver.TextOptions districtTextOptions = new xserver.TextOptions
  {
      font = districtFont,
      textColor = new xserver.Color { red = 0, green = 0, blue = 0 },
      fillBg = true,
      bgColor = new xserver.Color { red = 255, green = 255, blue = 255 },
      showFrame = true,
      frameColor = new xserver.Color { red = 0, green = 0, blue = 255 },
      alignment = xserver.TextAlignment.BOTTOM_LEFT,
      pixelX = 20,
      pixelY = 20,
      relX = 0,
      relY = 0
  };

  // Step 12: Create texts array
  Texts[] texts = new Texts[] {
      new Texts {
          options = districtTextOptions,
          wrappedTexts = districtInfos
      }
  };

  // Step 13: Define customLayer and set the texts visible
  CustomLayer textLayer = new CustomLayer
  {
      drawPriority = 25001,
      name = "Text layer",
      objectInfos = ObjectInfoType.REFERENCEPOINT,
      visible = true,
      wrappedTexts = texts
  };

  //Step 14: Add all CustomLayers (bitmaps and texts) to a Layer array
  Layer[] layers = new Layer[2];
  layers[0] = customBMPLayer;
  layers[1] = textLayer;

  bool includeImageInResponse = false;

  try
  {
      // Step 15: Return map object with its characteristics
      Map map = client.renderMap(null, mapParams, imageInfo, layers, includeImageInResponse, null);

      // Step 16: Retrieve image
	  String imageUrl = "http://" + map.image.url;
      // Create BitmapImage
      BitmapImage bitmapImage = new BitmapImage();

      // Display BitmapImage
      bitmapImage.BeginInit();
      bitmapImage.UriSource = new Uri(imageUrl);
      bitmapImage.EndInit();

      img1.Source = bitmapImage;

  }
  catch (Exception e)
  {
      // proper exception handling: see API for PTV's exception handling!
  }
}
Copyright © 2025 PTV Logistics GmbH All rights reserved. | Imprint