How to Display POIs
Using additional data content from PTV, you can draw POIs delivered with the PTV maps or individual data. It is possible to use bitmaps and show labels.
PTV periodically generates POIs for the European and North American maps which were automatically provided by the map providers (TomTom and HERE).
A list of the available POI types can be found here.
Testing your Installation
Test your configuration with the PTV Raw Request Runner in the PTV xMap Management Console. Send the following JSON request. To show POI-data, you need to add the layer information to the request –as marked in red in the request:
 PTV xMap JSON Sample Request
{
  "mapSection": {
    "center": {
      "point": {
        "x": 681737.63,
        "y": 6375240.97
      }
    },
    "scale": 992,
    "scrollHorizontal": 0,
    "scrollVertical": 0,
    "zoom": 0
  },
  "mapParams": {
    "showScale": true,
    "useMiles": false
  },
  "imageInfo": {
    "format": "BMP",
    "width": 400,
    "height": 400,
    "imageParameter": ""
  },
  "layers": [
    {
      "$type": "SMOLayer",
      "name": "default.points-of-interest",
      "visible": true,
      "objectInfos": "GEOMETRY",
      "configuration": ""
    }
  ],
  "includeImageInResponse": true,
  "callerContext": {
    "properties": [
      {
        "key": "CoordFormat",
        "value": "PTV_MERCATOR"
      },
      {},
      {}
    ]
  }
}
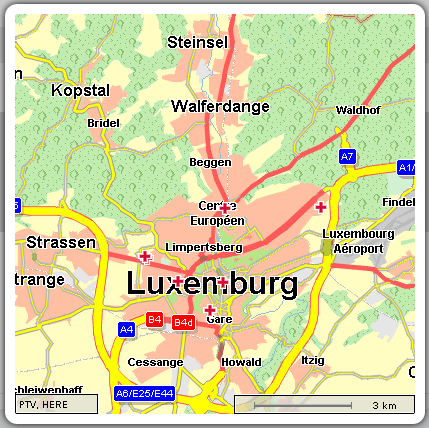
As a result you should get a map section with rendered POI icons of all available POI-types.
By specifying the POI-type in the layer configuration you only receive the configured POI-type:
"layers": [
    {
      "$type": "SMOLayer",
      "name": "default.points-of-interest;[POITYPE]='7321'",
      "visible": true,
      "objectInfos": "GEOMETRY",
      "configuration": ""
    }
  ],
The POI-type "7321" stands for hospitals. Your result should show the hospitals on the map.
The following example is based on the basic mapping sample with map section. We will omit steps that were dealt with in that simple example. So you should be familiar with the it before working through the code below.
If you use the feature to set the property centerObjects of the CustomLayer to true, the PTV xMap Server will generate a map that contains all visible object with a margin of 20 pixels. That means that the objects closest to the boundaries of the map will be 20px away from it. In some cases they might be hidden behind the copyright or the scale. If you want to change this margin, you have to modify the values for layers.margin in the file conf\xmap-default.properties. Please keep in mind that you have to restart the PTV xMap Server for the changes to take effect.
GeoDatasource Configuration
Besides points of interest data you can also search for additional custom geographic data by defining your own Geodatasource and applying it to a PoiAddress or PoiLocation object.
For a search request on custom geographic data you need a GeoDatasource configuration name, the layer name and the profile name. These information have to be set in the request using the geodatasourceLayer attribute of PoiAddress or PoiLocation. It has to be formatted as follows:
<configuration>.<layername>[.<profile][;<SQL Filter>]
<configuration>The geodatasource configuration name is the part of the filename<configuration>-geodatasource.xml. The layer name and the profile is /configured in this file.<layername> This is the attribute name of the XML element LayerInfo and determines the layer to be used.<profile> The configuration can list several profiles under the tag Profiles. This attribute specifies which of these should be referred to. If omitted default is assumed. If the default profile does not exists, the first profile of the profile list is used.<SQL Filter> Additionally,an SQL filter statement can also be added. For this SQL filter you can use the column names of the database or attribute names in brackets (like[TYPE]). These attribute names are defined in the <AttributeMappings> of your used LayerInfo in the file <configuration>-geodatasource.xml. With the AttributeMapping column names can be mapped to attribute names. A column name can only be used once in a AttributeMappings element. The SQL filter will be attached at the end of the WHERE clause. Valid expressions are comparisons (<, >, =, like, …). Concatenations of expressions are possible with the SQL operators AND and OR.
Defining a PlainPoint
The most basic information we can provide about the points we want to display are their coordinates. We have to put them into a PlainPoint
Step 1: Instantiate a new object PlainPoint.
Java snippet
// Note: Third dimension added; necessary for java clients 1.17 and higher
PlainPoint plainPoint1 = new PlainPoint(681254.0, 6372399.0, null);
PlainPoint plainPoint2 = new PlainPoint(682875.0, 6369972.0, null);
Defining a Point
PlainPoint objects must be set into the classes point1 and point2 as initiated objects of Point.
Step 2: Define two objects of the type Point.
Java snippet
Point point1 = new Point();
point1.setPoint(plainPoint1);

Point point2 = new Point();
point2.setPoint(plainPoint2);
Creating an Array of Bitmap
As the next step, we have to define an array of Bitmap[ ] which will be filled with following elements:
-
position: This element contains the geographical information where to place the object, therefore we have to put our Points here.
-
descr: Also important is the property descr (description) as this identifies the bitmap within the response from the PTV xMap Server. If you want to get to know the pixel-position of the painted object, you have to search for the description name to retrieve the information. Later on you also have to specify the enum value ObjectInfoType.REFERENCEPOINT as objectInfos property for the CustomLayer.
-
name: This property is defined by its name of the graphic we want to display. The graphics should be stored in the folder \data\bitmaps\. The bitmap type bmp is the only accepted graphics format.
Step 3: Define bitmapArray and set the above described properties. Use Bitmap flaggreen for start location and flagred for destination.
Java snippet
Bitmap[] bitmapArray = new Bitmap[2];
bitmapArray[0] = new Bitmap();
bitmapArray[0].setDescr("MyFirstBitmap");
bitmapArray[0].setPosition(point1);
bitmapArray[0].setName("flaggreen.bmp");

bitmapArray[1] = new Bitmap();
bitmapArray[1].setDescr("MySecondBitmap");
bitmapArray[1].setPosition(point2);
bitmapArray[1].setName("flagred.bmp");
Defining the BitmapOptions
For the BitmapOptions we set the color that we want to have transparently displayed in the generated map. In this example we use graphics as an own content of the PTV xMap Server. The goal is that the white color becomes transparent in the visualised map frame.
Step 4:Set the bitmapOptions. Add the referencePoint as a 20x20-pixel bitmap and define the transparency. Please notice the comments in the following code snippet.
Java snippet
BitmapOptions bitmapOptions = new BitmapOptions();

// change the reference point for the pixel position of the bitmap
// by default the bitmap center will be used.
// here: bitmap displacement of 20 pixels
PlainPoint referencePoint = new PlainPoint(20, 20, null);
bitmapOptions.setReferencePoint(referencePoint);

bitmapOptions.setTransparencyColor(new Color(255,255,255) );
Creating an Array With the Bitmaps
Now we have to define an array of Bitmaps[ ] where we have to add our created objects "bitmapArray" and "bitmapOptions" that contain the above defined properties.
Do not be confused by the native classes new Bitmap[ ] and new Bitmaps[ ]. It is easy to miss the difference!
Step 5:Create a new array bitmaps and add the objects bitmapArray and bitmapOptions.
Java snippet
Bitmaps[] bitmaps = new Bitmaps[]{ new Bitmaps(bitmapArray, bitmapOptions ) };
Defining a CustomLayer
Now that we have all of our bitmaps ready we have to put these into the CustomLayer. It is important to know that you have to specify the level where you want to place your layer. This can be specified using the property drawPriority at our CustomLayer. And don't forget to set the property visible to true.
To get the information where the objects have been placed on the generated map (for example to implement some client side click on object logic) you also have to set the objectInfos property to the enum value ObjectInfoType.REFERENCEPOINT. Then you will retrieve the pixel positions of each bitmap.
Step 6:Define CustomLayer and set some necessary properties. This object, including two bitmaps, should be visible therefore set the property true.
Java snippet
CustomLayer customLayer = new CustomLayer();
customLayer.setCenterObjects(true);
customLayer.setDrawPriority(25000);
customLayer.setName("ObjectLayer");
customLayer.setObjectInfos(ObjectInfoType.REFERENCEPOINT);

customLayer.setVisible(true);
customLayer.setBitmaps(bitmaps);
Creating an Array With the Layers
Last but not least, instantiate a new Layer[ ] array layers before calling renderMap(). This array contains the new defined CustomLayer.
Step 7:Add CustomLayer to layers.
Java snippet
Layer[] layers = new Layer[]{ customLayer };
Calling
The fourth argument of the method renderMap() has to be filled with the class layers. Before, you add the objects mapsSection, mapParams and imageInfo. The last argument is defined by includeImageInResponse.
Step 8:Call renderMap( ).
Java snippet
Map map = xmapClient.renderMap(mapSection, mapParams, imageInfo,
layers, includeImageInResponse);
Getting the Pixel Position
To read out the pixel position of the placed bitmaps you have to proceed as follows (chosen format = Plain):
map.getObjects()[i].getObjects()[j].getPixel().getPoint().getX()
map.getObjects()[i].getObjects()[j].getPixel().getPoint().getY()
Step 9:Print the pixel position of each bitmap.
Java snippet
System.out.println( String.format("%s (%.0f, %.0f)", "Pixel position of first point:",
objInfo[0].getObjects()[0].getPixel().getX(),
objInfo[0].getObjects()[0].getPixel().getY()));
Source Code
The example drawing a route with POIs is also executable as a stand-alone java program.
Copyright © 2025 PTV Logistics GmbH All rights reserved. | Imprint